Operations experience
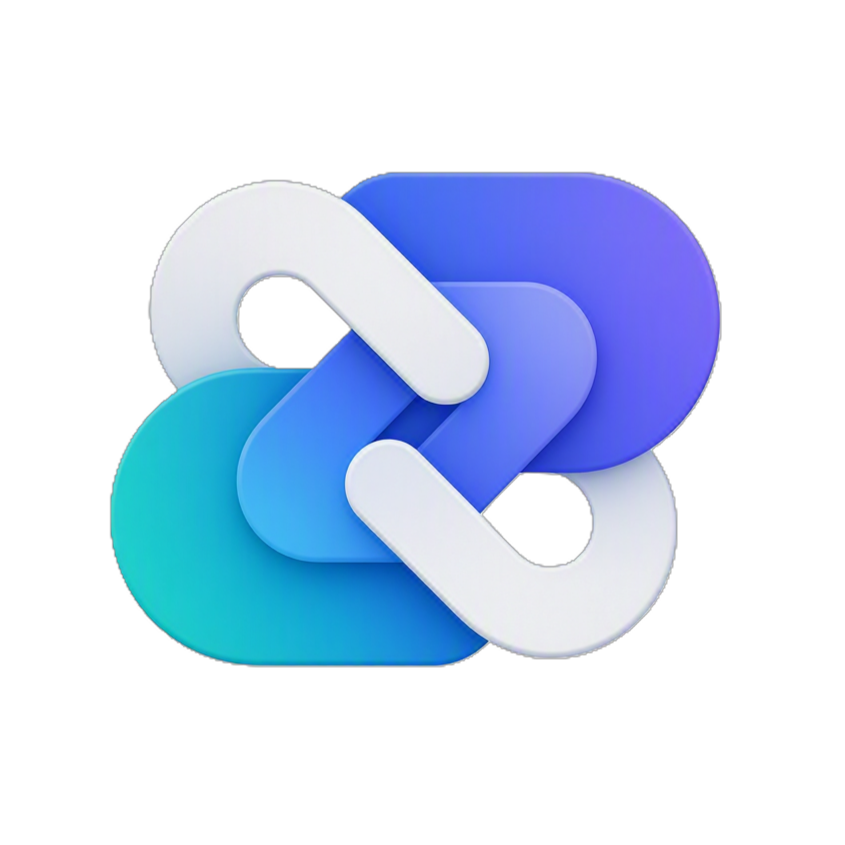
Operations is where Agentweaver users answer one practical question: is the system ready to keep agents moving safely? The web UI makes that state visible through Settings, Diagnostics, Heartbeat, Flow, and project sandbox policy; MCP exposes the same core facts through focused tools.
Scope: this page covers operations surfaces that exist today; it does not describe unsupported cost metrics, hidden telemetry, or deployment settings that are not exposed in the product.
Related context: Overview, Projects, Workflows & backlog, MCP client experience, Configuration, Events & observability, Sandbox, and Infrastructure & deployment.
Mental model
Agentweaver operations is a control room, not a general admin console. A user usually comes here to:
- confirm that the backend is healthy;
- confirm that heartbeat is ticking and picking up Ready work;
- see which agents are active, queued, blocked, or done;
- inspect or change a repository sandbox policy;
- separate project configuration from system health.
The backend remains the source of truth. The web UI renders snapshots, badges, cards, and empty states. MCP tools return the same operational facts as structured results an assistant can summarize or act on.
The important operating rule is: Agentweaver shows real state. Diagnostics can warn or fail. Heartbeat can be running, waiting_first_tick, or disabled. Flow can be empty. Sandbox policy can prevent shell execution even when the project itself is available.
Operations surfaces at a glance
| Surface | Where the user goes | What it answers | MCP parity |
|---|---|---|---|
| Settings | Global Settings page | Which sandbox policy applies to a repository path? | sandbox_policy_get, partially sandbox_policy_set |
| Project Settings | Project Settings → Sandbox policy | Which sandbox policy applies to this project's working directory? | sandbox_policy_get, partially sandbox_policy_set |
| Diagnostics | Project Diagnostics page | Is the system or project healthy enough to operate? | diagnostics_get for global diagnostics |
| Heartbeat | Project Heartbeat page | Is background automation enabled, ticking, and acting? | heartbeat_status |
| Flow | Project Flow page | What is each agent working on right now? | Indirect through board/run/coordinator tools |
| Cluster | Project Cluster page (SYSTEM section) | Are pods healthy and scheduling, are any pods orphaned? | GET /api/diagnostics/cluster |
| Observability > Traces | Project Observability → Traces | How did a coordinator transaction move through agent turns, tool calls, and LLM spans? | GET /api/metrics/runs/{runId}/traces |
Use Diagnostics when something feels broken. Use Heartbeat when Ready work is not being claimed. Use Flow during active multi-agent work. Use Settings before changing command execution posture. Use Cluster when runs are slow to schedule or pods are accumulating.
Settings experience
Settings has two user-facing scopes:
- global Settings, which edits sandbox policy by repository path;
- project Settings, which configures one project.
Project Settings includes project name, repository link, default model, sandbox policy, review policy, and danger-zone actions. For project management and MCP project_configure, see Projects. The global Settings page itself exposes only Sandbox policy.
Global Settings
The global page title is Settings. Its only section is Sandbox policy. The user enters Repository path showing example C:/path/to/repo, then selects Load policy.
After loading, the page shows:
- Shell execution — switch label Enabled or Disabled.
- Sandbox enabled — switch label On — commands run in the sandbox or Off — no isolation layer.
- Outbound network — switch label Enabled or Blocked. It is disabled when sandboxing is off.
- Allowed repository roots — read-only list, or None configured.
- Blocked command patterns — read-only list, or None configured.
- Save — persists the full loaded policy and shows Policy saved. on success.
This page is useful when the user knows the repository path but is not already inside a project.
Project Settings sandbox policy
Project Settings has an in-page rail. The operations-relevant section is Sandbox policy, described as Control how agent commands execute and what they may reach. It loads from the project's working directory, so the user does not type a path.
The section shows the same policy fields as global Settings and saves with Save. On success, it shows Sandbox policy saved. On failure, the API error appears inline.
Use project Settings when changing the policy for an active project. Use global Settings when checking a repository path outside the project context.
What Settings does not expose
The global Settings page does not expose API keys, provider secrets, CORS, database paths, worktree paths, Kubernetes routing, or Key Vault values. Those are runtime and deployment configuration; see Configuration and Infrastructure & deployment.
Diagnostics experience
Diagnostics answers: is Agentweaver healthy enough to operate right now? It is read-only and runs real checks over live state.
The page title is Diagnostics with subtitle System and project health checks. It provides:
📸 Screenshot —
diagnostics-checks.pngShows: the Diagnostics page titled "Diagnostics" / "System and project health checks." with the Global / This project tabs (aria-label="Diagnostics scope"), the Auto-refresh switch, the Re-run button, the Updated timestamp, and the check list (aria-label="Diagnostics checks") header "Checks (n) · {ms} ms" withpass/warn/failbadges. Path: open a project → click Diagnostics in the left rail →/projects/:projectId/diagnostics.
- Global and This project tabs;
- Auto-refresh switch;
- Re-run button;
- Updated timestamp;
- summary cards;
- check cards with
pass,warn, orfailbadges and durations.
Global diagnostics show API version, Uptime, Total projects, Total runs, and Active runs. Project diagnostics show Project and Checks. The check section reads Checks (n) · duration ms. Each card shows name, status, detail, and elapsed milliseconds. If no rows are returned, the page says No checks reported.
When to use Diagnostics
Open Diagnostics when:
- the API is reachable but a page behaves unexpectedly;
- a project cannot be opened, synced, or run;
- GitHub-dependent actions warn or fail;
- board state does not reflect expected work;
- heartbeat needs broader context;
- an operator wants a before/after health check around deployment or configuration changes.
Global diagnostics are process-wide. Project diagnostics are workspace- and project-specific. The API can be healthy while one project workspace is unavailable.
MCP diagnostics
MCP exposes global diagnostics with diagnostics_get. The tool returns a real-time system snapshot: API version, process uptime, project and run counts, heartbeat state, and checkpoint GC state.
Use diagnostics_get when an assistant needs to answer “is Agentweaver healthy?”, “how long has the API been up?”, “how many runs are active?”, or “what does the backend report about heartbeat and checkpoint GC?” It is read-only.
Checkpoint GC
Checkpoint GC appears as operational state inside diagnostics. The Diagnostics page reports checkpoint GC health; it does not tune checkpoint cleanup.
Heartbeat experience
Heartbeat answers: is background automation ticking, and did it act? The coordinator heartbeat service runs on an interval and drives backlog pickup from Ready into active coordinator work.
📸 Screenshot —
heartbeat-status.pngShows: the Heartbeat page titled "Heartbeat" / "Background automation status and recent ticks." with the Auto-refresh switch and Refresh button, the Automations section, and the Recent activity table (aria-label="Recent heartbeat ticks"). Path: open a project → click Heartbeat in the left rail →/projects/:projectId/heartbeat.
The page title is Heartbeat with subtitle Background automation status and recent ticks. It provides:
- Auto-refresh switch;
- Refresh button;
- service status badge;
- enabled flag and interval;
- last tick time;
- last error, when present;
- Automations cards;
- Recent activity table.
Service status
The status badge can be:
running— enabled and has ticked;waiting_first_tick— enabled but no completed tick yet;disabled— background automation is off.
The row also shows Enabled or Disabled, interval Ns, and Last tick. If there is no tick time, it shows —.
waiting_first_tick is normal shortly after startup. If it persists beyond the interval, refresh the page and then check Diagnostics. disabled means Ready backlog pickup will not run through heartbeat.
Automations and recent activity
The Automations section shows the real automation catalog, including Coordinator Heartbeat and Checkpoint GC. Each card shows name, status, description, Cadence: every Ns, Last run, and last acted count when available.
The Recent activity table shows completed ticks:
- Automation (first column) — which background automation produced the tick record (e.g. Coordinator Heartbeat or Checkpoint GC)
- When
- Acted
- Errors
- Duration
- Error
If no ticks exist, the page says No ticks recorded yet. That is expected before the first tick, after process start, or when heartbeat is disabled.
MCP heartbeat
MCP exposes heartbeat with heartbeat_status. The tool returns enabled flag, interval, last tick time, and service state (running, waiting_first_tick, or disabled).
Use heartbeat_status when an assistant needs to answer whether backlog pickup is running, when the last tick occurred, or whether heartbeat is disabled versus waiting for its first tick. The tool is read-only.
Flow experience
Flow answers: what is each agent working on right now? It is the live agent activity view for a project.
The page title is Flow. The default subtitle is What each agent is working on right now. With an agent filter, it becomes Live work and terminal-run archive for {agent}. Flow auto-refreshes every five seconds and also provides Refresh.
📸 Screenshot —
flow-agents.pngShows: the Flow page titled "Flow" / "What each agent is working on right now." with the Refresh button and per-agent cards sorted by operational pressure (active, then queued, then blocked); with an agent selected, the Previous work archive section (aria-label="Previous work archive") and the "Live work and terminal-run archive for {agent}." subtitle. Path: open a project → click Flow in the left rail →/projects/:projectId/flow.
Flow reads the project board's agent_queues projection and sorts agents by operational pressure: active work first, then queued work, then blocked work.
Agent cards
Each agent card shows:
- agent avatar and name;
- active, queued, blocked, and done badges;
- Idle when there is no active, queued, or blocked work;
- orchestration groups when the agent has work across coordinator runs;
- sample subtask titles;
- View orchestration links.
An orchestration group shows the title when present, otherwise a shortened orchestration id. It then shows that agent's counts inside the orchestration and links to the orchestration detail page.
Flow is not a full run timeline. It is the team-load view: who is busy, who is waiting, who is blocked, and which orchestration deserves attention.
Agent filter and archive
When opened with an agent filter, Flow shows an Agent filter badge, the agent name, and Clear filter. It also shows Previous work archive for terminal runs: completed, merged, assemble-ready, declined, failed, and merge-failed work. Each archive item links to the execution page and shows status, timestamp, and model id when available.
Empty states
Flow states are explicit:
- No active agents — no current agent queue projection; the page says to start an orchestration to see live activity.
- No active work for {agent} — that agent has no current in-flight subtasks; completed work remains in the archive.
- No terminal runs found for this agent. — the selected agent has no terminal archive entries.
An empty Flow page is not automatically a system failure. Check the board for Ready work, Heartbeat for pickup, and Diagnostics for backend health.
Sandbox policy experience
Sandbox policy answers: what may agent commands do for this repository? It is repository-scoped. The same policy can be reached from global Settings, project Settings, and MCP tools.
At a user level, the policy controls:
- whether shell execution is available;
- whether commands run in a sandbox or directly on the host;
- whether outbound network is enabled when sandboxing is on;
- which repository roots are allowed;
- which destructive command patterns are blocked or require stronger handling.
The deeper model is layered: governance, filesystem containment, execution isolation, network boundaries, and bounded/redacted output. See Sandbox.
UI policy fields
| UI label | User meaning |
|---|---|
| Shell execution | Enables or disables agent shell commands for the repository. |
| Sandbox enabled | Chooses sandboxed execution versus Off — no isolation layer direct host execution. |
| Outbound network | Enables or blocks network access for sandboxed commands; disabled when sandboxing is off. |
| Allowed repository roots | Shows recognized repository roots; the UI displays this list but does not edit it. |
| Blocked command patterns | Shows destructive command patterns; the UI displays this list but does not edit it. |
📸 Screenshot —
sandbox-policy.pngShows: the Sandbox policy section (reached from project Settings) with the Shell execution, Sandbox enabled, and Outbound network switches, plus the read-only Allowed repository roots and Blocked command patterns lists. Path: open a project → Settings → Sandbox policy →/projects/:projectId/settings(Sandbox policy section).
The UI saves the full loaded policy so list fields are preserved even when the user only toggles a switch.
MCP sandbox policy tools
| Tool | What it does |
|---|---|
sandbox_policy_get | Gets the sandbox policy for a repository. The repository path is optional. |
sandbox_policy_set | Sets shell access for a repository by repository_path and shell_enabled, then returns Sandbox policy updated successfully. |
The MCP setter is narrower than the web UI. It changes shell enablement; it does not expose every policy field the UI can round-trip. Use the web UI when reviewing sandbox mode, network posture, allowed roots, and blocked patterns together.
Direct mode and network mode
When Sandbox enabled is off, commands run directly on the host with no isolation layer. Direct mode is not sandbox isolation and should be limited to trusted or disposable environments.
When sandboxing is on, Outbound network controls sandboxed command network access. In production, cluster network policy and sandbox infrastructure also enforce the lower-level boundary.
Web and MCP parity
- Web Diagnostics and MCP
diagnostics_getreport live diagnostics facts. The web page adds project scope, cards, durations, and auto-refresh. - Web Heartbeat and MCP
heartbeat_statusreport heartbeat state. The web page adds automation cards, recent tick history, error display, and auto-refresh. - Web Settings/Project Settings and MCP
sandbox_policy_get/sandbox_policy_settouch repository sandbox policy. The web UI exposes the full displayed policy; the MCP setter changes shell enablement. - Web Flow has no dedicated MCP tool. MCP clients inspect board, run, and orchestration state through backlog, run, and coordinator tools.
Humans get visual scanning and judgment points. Assistants get compact tools for reporting and narrow safe mutations.
Edge cases and how to read them
Heartbeat disabled
If Heartbeat shows disabled, background pickup is off. Ready tasks remain ready until work starts another way or heartbeat is enabled in runtime configuration. Diagnostics, Flow, and Settings remain usable.
Waiting for first tick
waiting_first_tick means heartbeat is enabled but has not completed a tick in this process lifetime. It is expected immediately after startup. If it persists beyond the interval, check Last error and then Diagnostics.
No ticks recorded yet
No ticks recorded yet. usually means first tick has not completed, the API process recently started, or heartbeat is disabled.
Empty diagnostics
No checks reported. means the selected diagnostics response contained no check rows. Treat it as a visible source gap, not a hidden success. Re-run, switch scope, and compare with MCP diagnostics_get if needed.
Diagnostics warn or fail
Warnings and failures are normal operational outputs. A missing GitHub CLI auth state can warn. An unreadable workspace or failed active workflow can fail at project scope. Read the check detail before changing settings.
No active agents in Flow
No active agents means there is no current agent queue projection. It can mean no active coordinator runs, heartbeat has not claimed Ready work yet, all work is complete, or the project has no current subtask projection.
Selected agent has no active work
No active work for {agent} means that agent has no current in-flight subtasks. Clear the filter to see other agents, or use the archive for terminal work.
Sandbox policy cannot load or save
Policy errors appear inline as API errors. Check the repository path, project working directory, caller authorization, and backend workspace access.
Network switch disabled
Outbound network is disabled when Sandbox enabled is off because network policy applies to sandboxed execution, not direct host execution.
Practical playbooks
Ready work is not starting
- Confirm work is in Ready on the board.
- Open Heartbeat and check status, interval, last tick, and recent activity.
- If status is
waiting_first_tick, wait one interval or select Refresh. - If status is
disabled, heartbeat pickup is not running. - If ticks happen with zero acted count, review backlog settings and task eligibility in Workflows & backlog.
- Open Diagnostics for storage, configuration, heartbeat, and project checks.
Agents are active but work feels stuck
- Open Flow.
- Look for blocked counts or one agent with a large queued load.
- Select View orchestration from the relevant card.
- Inspect topology, child runs, timeline, questions, approvals, RAI flags, failures, and review gates.
- Use the agent filter and Previous work archive when the same agent repeatedly fails or declines work.
A command should not be allowed
- Open project Settings → Sandbox policy.
- Confirm Shell execution is correct.
- Keep Sandbox enabled on unless the environment is explicitly trusted.
- Set Outbound network to blocked when network is not needed.
- Review Blocked command patterns.
- Use
sandbox_policy_getwhen an assistant needs to report policy before acting.
Assistant-driven operations check
A good MCP sequence is:
diagnostics_getfor system health;heartbeat_statusfor background automation;sandbox_policy_getfor the target repository when command execution matters;- summarize pass/warn/fail checks, heartbeat state, interval, last tick, and shell enablement;
- call
sandbox_policy_setonly when the user specifically wants shell execution changed for that repository.
Limits and source of truth
Operations pages are snapshots and projections over backend state. They do not replace deployment configuration, cluster telemetry, source-control review, or lower-level sandbox enforcement. The backend API remains authoritative; the web UI renders it, and MCP tools forward structured operations to it.
Cluster page experience
The Cluster page is the SYSTEM-section operations view for Kubernetes cluster health. It is available under the Cluster nav item (Server24Regular icon) at /projects/:projectId/cluster.

📸 Screenshot —
cluster-page.pngShows: the Cluster page with KPI cards (Active pods, Orphaned pods, CPU used/total, Pending runs), quota bars (CPU, memory), the component health table, and the Active / Orphaned / Pending pods tables. Path: open a project → click Cluster in the SYSTEM left rail section →/projects/:projectId/cluster.
The page provides:
- KPI cards — Active pods, Orphaned pods, CPU used/total, Pending-capacity runs
- Quota bars — CPU and memory usage, color-coded by saturation. Since #217 removed the
ResourceQuotaCPU/memory caps there is no hard limit to fill against, so these bars no longer represent an enforced ceiling; object-count quotas (pods, sandbox claims, PVCs, storage) are the enforced bounds. - Component health table — 6 checks: Postgres, GitHub token store, Azure Key Vault, namespace quota, warm-pool, Kubernetes API server
- Active agent pods table — pods currently serving a live run
- Orphaned agent pods table — pods with no matching active run (will be reaped on the next sweep)
- Pending-capacity runs table — legacy / back-compat; subtasks recorded in the historical
PendingCapacitystatus. Empty for new runs, since Kubernetes now owns scheduling.
When the API is not deployed on AKS (or the cluster diagnostics endpoint returns 404), the page falls back gracefully and shows a message indicating cluster diagnostics are unavailable.
Full user guide: see Cluster page guide for a walkthrough of each KPI and how to interpret quota warnings. API reference: see Cluster diagnostics reference for the full response schema.
See also
- Token usage monitoring — project and app-level AI Credit dashboards, part of the broader operations picture.