Token usage and cost visibility
Agentweaver tracks GitHub Copilot token consumption and AI Credit (AIC) cost at run, workflow/coordinator, project, and app scope. The UI now surfaces that cost in compact run cards, graph nodes, the project dashboard leaderboard, and the fleet Overview page. For API contracts see the reference; for event/projection internals see the deep dive.
Run and graph cost surfaces
Token usage is projected from agent.turn.usage events and surfaced on run cards, coordinator graphs, dashboards, and observability pages. The standalone Watch page and its live counter have been retired with the standalone run-page surface.

📸 Screenshot —
watch-token-counter.pngShows: the coordinator run AI credits popover with total token/cost context and per-agent breakdown when available. Path:/projects/:projectId/orchestrations/:runId→ click the AI credits chip.
Run cards and DAG nodes
Run cards in the board show a compact cost chip beside the status badge. If total_nano_aiu is positive, the chip displays AICs; otherwise it falls back to compact token count when only tokens are available. Run cards use embedded card fields when present and fetch GET /api/runs/{id}/usage as supplementary data when the card did not include totals. Source: apps/web/src/components/CostChip.tsx:18, apps/web/src/components/CostChip.tsx:24, apps/web/src/components/board/RunCard.tsx:78, apps/web/src/components/board/RunCard.tsx:90, apps/web/src/components/board/RunCard.tsx:160.
Coordinator graphs use the same CostChip: coordinator usage attaches to the coordinator node and child-run usage attaches to subtask nodes. Source: apps/web/src/components/WorkflowGraphPanel.tsx, apps/web/src/pages/CoordinatorRunPage.tsx.
Project dashboard
The project dashboard's Agent and usage metrics range selector scopes both the Token and AIC usage panel and the leaderboard's Cost column. The selector offers Last 7 days, Last 30 days, and Last 90 days; changing it calls GET /api/projects/{id}/usage?from=...&to=..., then fetches scoped run usage to aggregate costs per leaderboard agent. Source: apps/web/src/pages/DashboardPage.tsx:40, apps/web/src/pages/DashboardPage.tsx:44, apps/web/src/pages/DashboardPage.tsx:289, apps/web/src/pages/DashboardPage.tsx:293, apps/web/src/pages/DashboardPage.tsx:299, apps/web/src/pages/DashboardPage.tsx:304, apps/web/src/pages/DashboardPage.tsx:425, apps/web/src/pages/DashboardPage.tsx:461, apps/web/src/pages/DashboardPage.tsx:494, apps/web/src/pages/DashboardPage.tsx:504.

📸 Screenshot —
dashboard-token-usage.pngShows: the project Dashboard with the shared range filter, Model performance panels, Agent leaderboard Cost column, and AI-credit/token diagnostics. Path:/projects/:projectId.
App overview (admin)
The Overview page aggregates recent-project metrics and shows the AI Usage & Performance section with a shared 7d/30d/90d range selector, token consumption by model, model usage distribution, response duration, TTFT, and success-rate tiles. Source: apps/web/src/pages/OverviewPage.tsx:222, apps/web/src/pages/OverviewPage.tsx:225, apps/web/src/pages/OverviewPage.tsx:239, apps/web/src/pages/OverviewPage.tsx:245, apps/web/src/pages/OverviewPage.tsx:272, apps/web/src/pages/OverviewPage.tsx:439, apps/web/src/pages/OverviewPage.tsx:442, apps/web/src/pages/OverviewPage.tsx:445, apps/web/src/pages/OverviewPage.tsx:450, apps/web/src/pages/OverviewPage.tsx:465, apps/web/src/pages/OverviewPage.tsx:475.

📸 Screenshot —
overview-token-usage.pngShows: the Overview page AI Usage & Performance section with range selector and model/cost/latency tiles. Path:/overview.
Project Observability
The project-scoped Observability section adds an AppInsights-backed view beside the older usage panels. The Overview tab calls GET /api/projects/{id}/metrics for the selected 7d/30d/90d range and renders compact tiles for runs created over time, AI credit usage over time, AI credit usage by model, model invocation share, response duration by model, and TTFT by model (apps/web/src/pages/observability/ObservabilityOverviewPage.tsx:31, apps/web/src/components/dashboard/ModelPerformancePanels.tsx:160). Empty charts say No AI credit usage data yet., No response-duration data yet., or No TTFT data available yet. rather than fabricating values (ModelPerformancePanels.tsx:186, :229, :234).
The Agents tab aggregates the same metrics by agent and reuses the token breakdown component (apps/web/src/pages/observability/ObservabilityAgentsPage.tsx:58). The Traces tab lists recent coordinator runs and opens an AppInsights trace preview; each lane is an agent, each bar is an agentic/LLM span, and expanding a bar shows model, input tokens, output tokens, duration, and operation (apps/web/src/pages/observability/ObservabilityTracesPage.tsx:108, apps/web/src/components/runs/TransactionTracePanel.tsx:260).
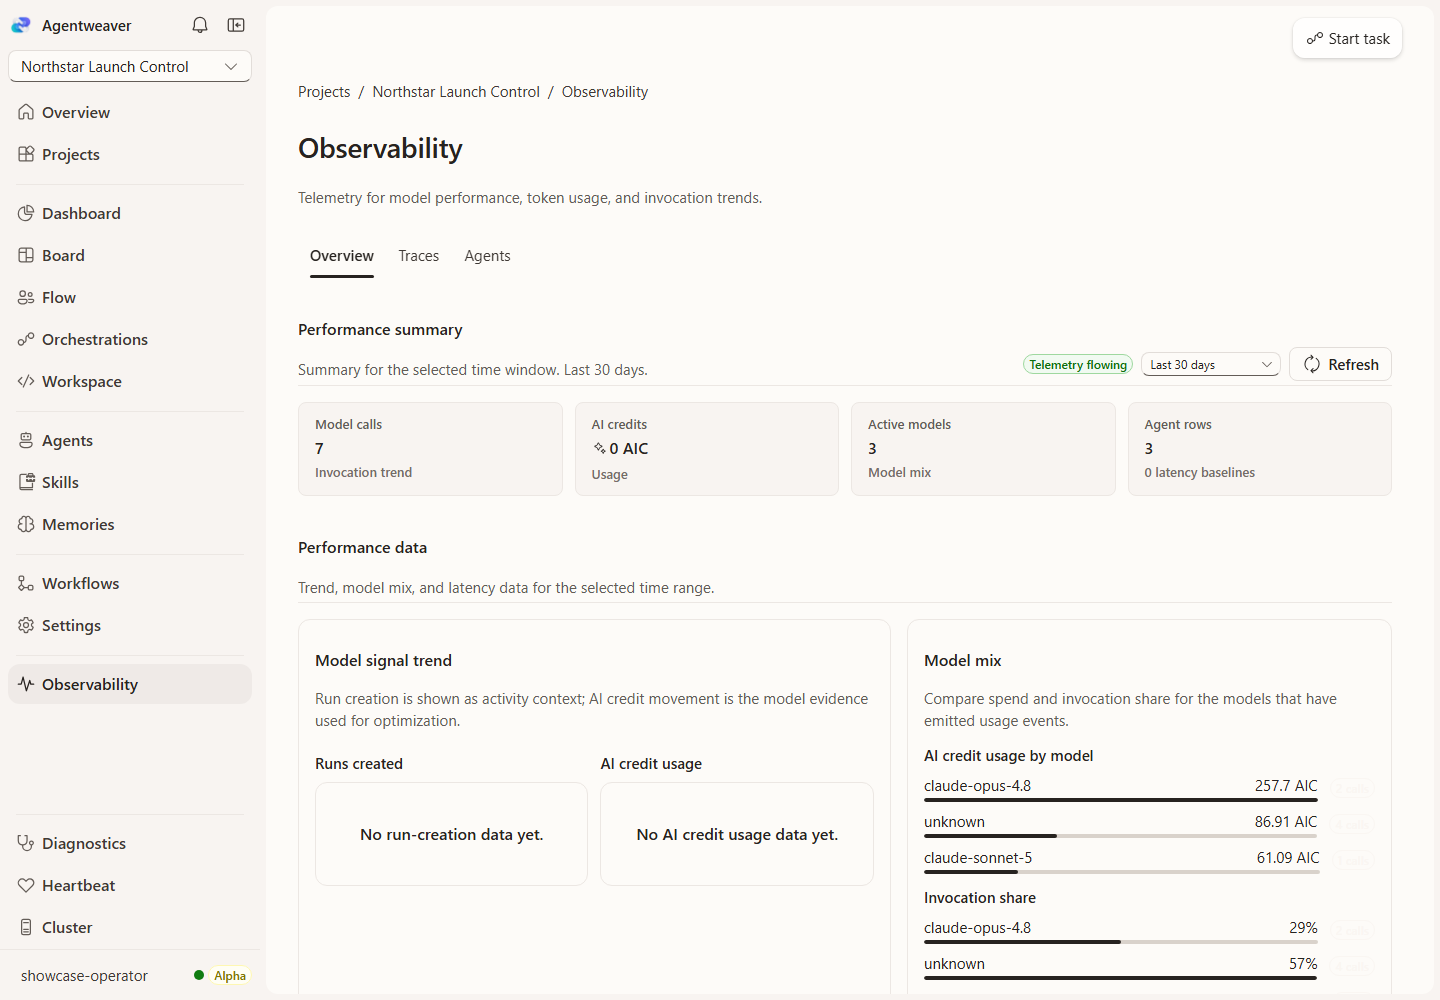
📸 Screenshot —
observability-overview.pngShows: the project Observability Overview tab with the range selector, Refresh, and model performance panels for run creation, AI credit usage, model distribution, response duration, and TTFT. Path: open a project → click Observability →/projects/:projectId/observability.
📸 Screenshot —
observability-agents.pngShows: the Observability Agents tab with Agent token breakdown aggregated by agent over the selected range. Path:/projects/:projectId/observability→ click Agents.
Understanding the numbers
| Term | What it counts | Source |
|---|---|---|
| Input tokens | Prompt tokens sent to the model. | apps/web/src/api/types.ts:1187 |
| Output tokens | Completion tokens returned by the model. | apps/web/src/api/types.ts:1189 |
| Total tokens | Aggregate token count for the selected run/project/app scope. | apps/web/src/api/types.ts:1190 |
| Total AICs | total_nano_aiu converted by formatAic. Values below 1 AIC show four decimal places. | apps/web/src/api/types.ts:1191, apps/web/src/components/CostChip.tsx:3 |
| Per-model breakdown | Model rows in by_model, used by TokenUsagePanel. | apps/web/src/api/types.ts:1179, apps/web/src/components/TokenUsagePanel.tsx:118 |
DAG layout note
The added cost chips and pod/status badges made DAG cards taller, so graph layout shares DAG_NODE_SEP = 96 and per-node rendered-height hints. Coordinator topology, shared workflow graph panels, and the visual workflow editor pass those hints into layoutDag, preventing node overlap as cards gain metadata. Source: apps/web/src/utils/dagLayout.ts, apps/web/src/components/CoordinatorTopologyGraph.tsx, apps/web/src/components/WorkflowGraphPanel.tsx, apps/web/src/components/VisualWorkflowEditor.tsx.
See also
- Token usage — Reference — endpoints, DTOs, and status codes.
- Token usage monitoring — Deep Dive — event flow, projections, and source table.
- Runs, board, and live inspection — run cards, the board, and embedded inspection flow.
- Distributed execution & scaling — shared event-store streaming under multiple replicas.