Sandbox pod execution experience
This page is about what a person sees and feels when Agentweaver runs each agent in its own per-run sandbox pod — both the user watching a run in the web UI and the operator reasoning about the cluster. For the design logic see the Sandbox pod execution deep dive; for flags, identity, and the token mechanism see the Sandbox pods reference.
Related journeys: Runs, board & watch, Coordinator & orchestration, Operations, and the A2A distributed agents experience.
Mental model
The most important thing to feel about pod-per-run is that almost nothing changes in how a run looks. The board, the live timeline, the coordinator topology, the review gate — all behave exactly as before. What changes is where the work physically runs: each run's agent now executes inside its own Kata-isolated pod instead of inside the shared API process. The product surfaces that fact in exactly one honest, low-key way — a pod name on the agent box — and otherwise stays out of the way.
A well-behaved run should make the user barely notice the sandbox. The pod pill is the one visible signal; everything else is the same experience they already know.
What the pod pill is
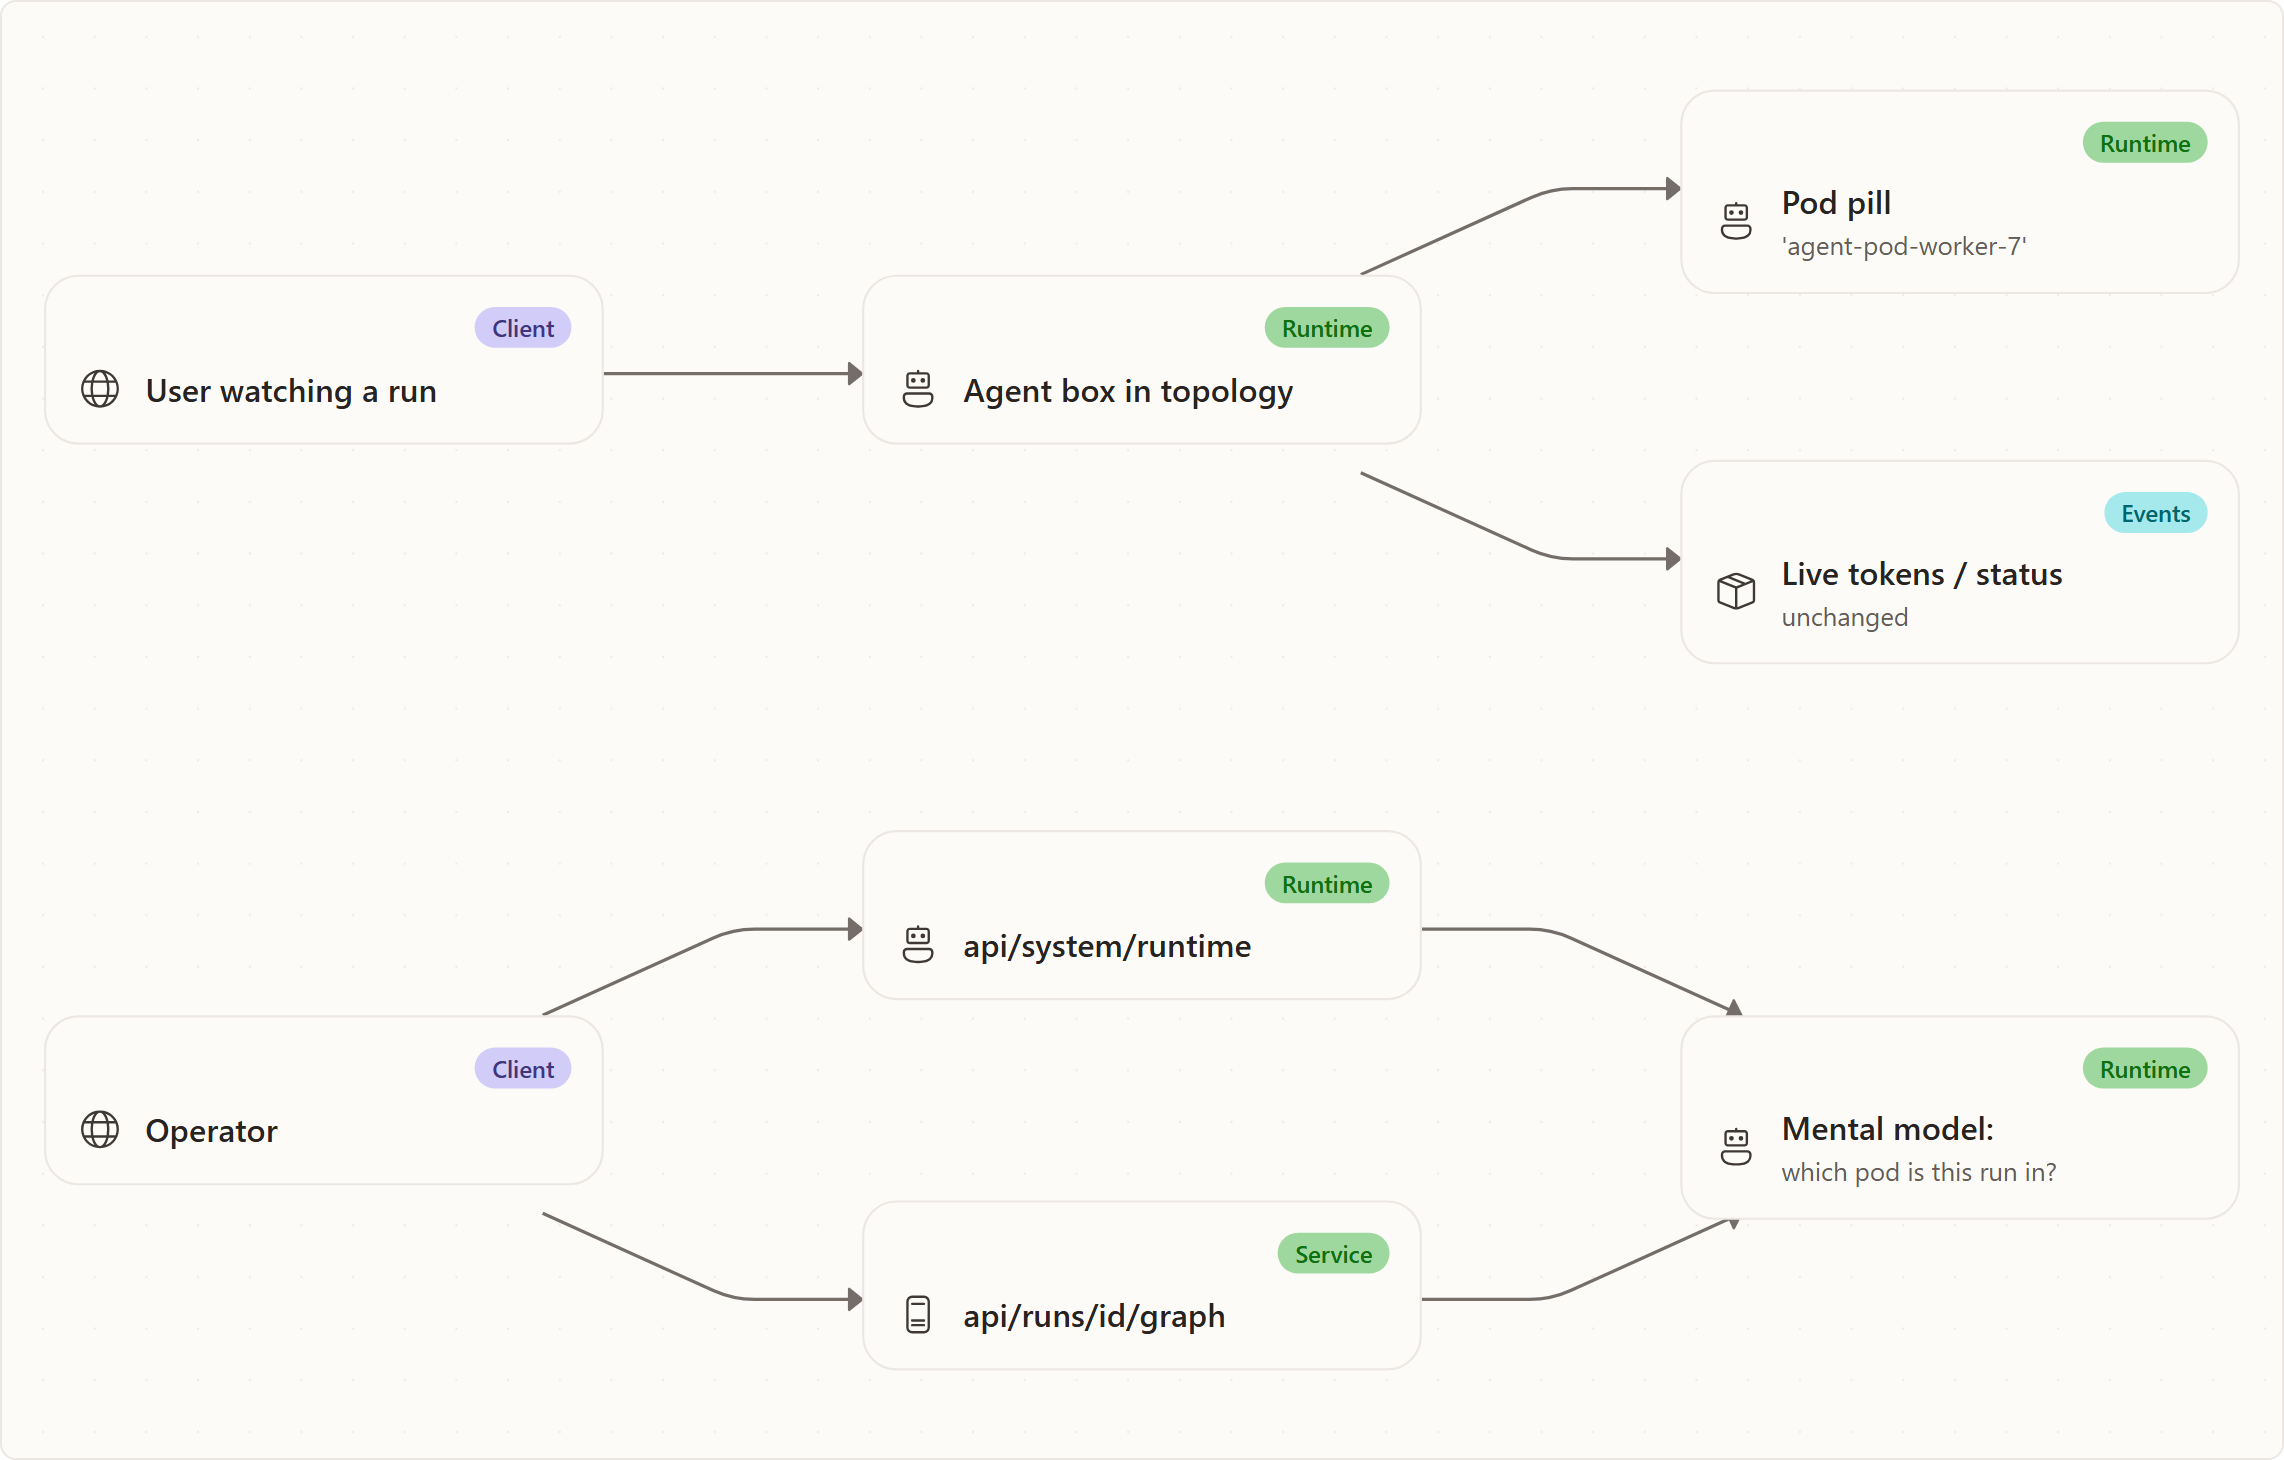
When the backend runs inside Kubernetes, each agent box in a run's topology shows a small pod pill — a compact, monospace pill with a server icon and the executing pod's name (for example agentweaver-api-abc123 or agent-pod-worker-7). Hovering it shows the tooltip "Executing in pod {name}", and it is exposed to assistive technology with the same label.
What the user can take from it:
- Where this agent is actually running. Under pod-per-run, the pill on a node is that run's sandbox pod, so two concurrently-running agents can show two different pod names — a direct, visible cue that their work is isolated from each other.
- That isolation is on at all. Seeing distinct pod names per run is the everyday confirmation that each run has its own pod.
The pill is Kubernetes-only and quiet by design:
- on local/dev runs, or anywhere the backend is not in Kubernetes, no pill is shown — the UI stays clean and there is nothing to explain;
- if the pod name is not yet known (the claim has not bound), no pill is shown rather than a placeholder; and
- if the runtime probe fails, the UI degrades silently to no pill rather than erroring.
Where the value comes from: each agent node carries an executionPodName (its own pod), and the app falls back to a global pod name from the runtime probe when a node has no per-node value. As the pod-per-run rollout proceeds, nodes carry their true per-pod names automatically. The binding is persisted in the shared run-event log, so the pill stays accurate after refresh and when served by another API replica. The data behind it is in the reference.
What happens during a run
From the user's side, submitting and watching a run feels identical to before:
- They submit work (or a coordinator goal) and watch the board / topology as usual.
- Agent boxes light up as running, stream tokens and status live, and — on Kubernetes — show their pod pill.
- The live timeline, diffs, and events arrive exactly as they always have; the fact that tokens are being produced inside a pod and streamed back to the worker is invisible in the stream itself.
- When the run completes, the box settles into its terminal state as usual.
Under the hood the heavy work — the model session, the tools, the shell — is happening in the pod, and the worker is relaying its stream into the same timeline. The user does not have to know that; the only new thing on screen is the pod name.
Sandbox preview: reaching a server inside the pod
Sometimes an agent starts a server inside its sandbox pod — a dev server, a freshly built app, a debug endpoint — and a person wants to actually open it and look. Because the pod is isolated, that server is not reachable by default. The sandbox preview port-forward is the supported way to reach it: a live preview/debug endpoint tunnelled from the run's pod, scoped to that one run.
A Preview Sandbox button appears on the coordinator run page only when the run is using the Kubernetes sandbox (sandboxBackend === 'kubernetes-sandbox-claim', read from the run's sandbox.selected event) and the run is still active. On local/dev backends, or after the run ends, the button is not shown. The flow a user follows:
- Open the preview dialog ("Sandbox Preview") and pick a port — the port the agent's server is listening on inside the pod (the field defaults to
3000). The dialog notes that preview traffic is proxied through the Agentweaver API server. - Start the preview. The app calls
apiClient.startPortForward(runId, port)→POST /api/runs/{runId}/sandbox/port-forwardwith that port, and akubectl port-forwardtunnel is opened from the run's sandbox pod to a loopback port on the API host. - See it become active. The dialog confirms with "Preview active for port {target_port} on pod {pod_name}" and shows the session id. If the API returned a proxied
preview_url, the dialog embeds it in an iframe with an "Open preview" button; if it did not (the backend does not currently populatepreview_url), the dialog honestly says "The API server did not return a proxied preview URL." - Stop it when done. Stopping the preview calls
apiClient.stopPortForward(runId, sessionId)→DELETEon that session, tearing the tunnel down. You can run more than one preview at a time (up to a per-run cap), each its own port and entry, and stop them individually.
When to use it:
- You want to look at what the agent built/ran — a running web app, an API the agent stood up, a served artifact — without leaving the run view.
- You're debugging inside the sandbox and need a live endpoint into the pod for the moment.
What to expect:
- Kubernetes-only. Preview tunnels into the agent-sandbox controller's pod. On local/dev runs there is no claim pod to forward, so the button doesn't appear — the same "this is a cluster feature" boundary as the pod pill. (Local runs isolate commands with MXC, which has no pod to forward into.)
- A loopback port, not a public URL. The API returns a
local_portit bound on the API host; whether a browser-openable preview appears depends on whether a proxiedpreview_urlis returned (today it is not). - Scoped to this run's pod. A preview reaches only the run's own sandbox pod, never another run's, and is capped (default 3 per run, 20 globally).
- Tied to the live pod. Because the hybrid lifecycle can release and re-claim a pod across a suspension, a preview is valid while the current pod is bound; after a release/resume you start a fresh preview against the re-claimed pod (the same reason the pod pill name can change). Sessions have no TTL and end on stop, run end, or API shutdown.
The endpoints and the PortForwardSessionDto fields behind the dialog are in the reference.
Dedicated pages: see the Sandbox browser preview User Guide for the full step-by-step, the Reference for the API, and the Deep Dive for how the tunnel works.
Suspend and resume, from the user's view
Pod-per-run uses a hybrid lifecycle: the pod stays warm while an agent is actively reasoning, but it is checkpointed and released when the run suspends on something external — most visibly, a human-review / confirmation gate, or a coordinator waiting on its child runs.
What the user experiences across that boundary:
- At a review/confirmation gate, the run pauses for them exactly as it does today — the gate looks and behaves the same. Behind the scenes the pod has been released back to the warm pool while the human decides, so no compute is held hostage by a pending decision.
- When they submit the decision, the run resumes seamlessly: a warm pod is re-claimed and the run is rehydrated from its checkpoint. The worktree is already there (it lives on the shared workspace volume), and the resumed pod gets a fresh run-scoped credential.
- The pod name may change after resume. Because resume re-claims a (possibly different) warm pod, the pod pill on the agent box can show a different name than before the pause. That is expected and is the visible trace of release-and-rehydrate; the run, its history, and its workspace are continuous.
For a coordinator run, the same applies while the coordinator idles awaiting children: it does not sit on a pod during the wait. Its orchestration loop stays in the worker the whole time — only its agent turns ever occupy a pod — so the coordinator's timeline and steering controls are always live even when no coordinator pod exists.
A debug/low-latency option exists for operators (Sandbox:ReleasePodOnSuspend = false) that keeps the pod warm across a suspension; with it on, the pod name would stay stable across a pause, at the cost of holding capacity. By default the pod is released, so a name change across a long pause is normal.
The operator's mental model
An operator reasons about pod-per-run as "each run rents a pod for its active bursts, and gives it back when it's waiting." Concretely:
- Mode is a flag.
Sandbox:AgentExecutionModedecides whether agents run in-process (in-api, today's behavior and the rollback path) or in per-run pods (pod-per-run). If anything looks wrong — including instability in the experimental transport — flipping back toin-apirestores in-process execution immediately, no redeploy.Sandbox:ReleasePodOnSuspend(default on) tunes whether pods are released during suspensions. - Kubernetes owns scheduling; the platform does not pre-gate on quota. More concurrent runs means more claimed AgentHost pods; the
agentweaver-agent-hostpool keeps 2 run pods pre-warmed. The platform no longer checks quota headroom before a launch — it submits theSandboxClaimand waits for Kubernetes to schedule and bind the pod, so a Pending pod is an expected transient state (a node is freeing up orkatapoolis autoscaling), not a failure. The namespaceResourceQuotabounds only object counts (pod count, sandbox-claim count, PVCs, storage) — it no longer caps CPU/memory, and those counts are raised deliberately in the manifests, not patched live. See Operations and the reference. - The isolation backend is chosen per host. Independently of pod-per-run, every host selects one command-isolation backend at run start and announces it with a
sandbox.selectedevent (backend,isRealIsolation,reason). In-cluster that backend is the Kata-isolatedkubernetes-sandbox-claim, whose pods are provisioned by the upstream agent-sandbox controller (installed byscripts/azure/steps/10-create-cluster.mjs); local dev getsprocesscontainer(MXC, a different local-host runtime) on Windows orlinux-bwrapon Linux, falling back todirect(no isolation, shell still runs) only when nothing else is available. The deep dive's executor seam and agent-sandbox controller sections explain how these relate to pod-per-run; backend install/selection is in Sandbox setup. - The pod is disposable. Killing or losing a pod does not lose a run: durable state is in the shared workspace volume and the brokered checkpoint, and the run re-claims a fresh pod. Pods never persist past their run, and they hold only a short-lived, run-scoped credential.
- Blast radius is small and visible. Each pod is Kata-isolated, default-deny on egress (model + worker + git only, never the database), and holds no broker key. The pod pill in the UI is the operator's quick "which pod is this run in?" answer.
Diagnostics surface (MCP and runtime)
The same facts are available outside the topology view:
GET /api/system/runtimeanswers "are we in Kubernetes, and what is the host pod name?" — the source of the global pod-pill fallback.GET /api/runs/{id}/graphcarriesexecutionPodNameper node — the authoritative "which pod is this run/node executing in?" for a specific run.- MCP operations tools expose the same operational health an operator needs around runs (diagnostics, heartbeat, sandbox policy). The MCP surface mirrors the web operations surface fact-for-fact; see the MCP client experience and Operations. Pod naming itself is a presentation detail surfaced primarily in the web topology; the underlying run/pod state is the same the API exposes.
The transport that carries agent turns into the pod is the A2A bridge, which ships on an experimental -preview package line. Operators should treat it as such — pinned and behind the rollback flag — and read the A2A distributed agents experience for what that means in practice.
Edge cases the user may notice
- No pill at all. Local/dev or non-Kubernetes backends never show the pod pill — expected, not a bug.
- Pill appears slightly after a node starts. The name is shown once the pod is bound and registered; a brief gap before the pill appears is normal.
- Pill name changes after a pause. Release-on-suspend re-claims a fresh pod on resume, so the name can change across a review gate or a coordinator wait. The run is continuous regardless.
- Two runs, two pod names. Concurrent runs showing different pod names is the visible proof of per-run isolation.
Related reading
- Sandbox pod execution deep dive — the why and the logic.
- Sandbox pods reference — flags, identity/quota, token injection, naming.
- Runs, board & watch and Coordinator & orchestration — the journeys this annotates.
- Operations — health, heartbeat, and sandbox policy surfaces.
- A2A distributed agents experience — the
-previewtransport behind it.